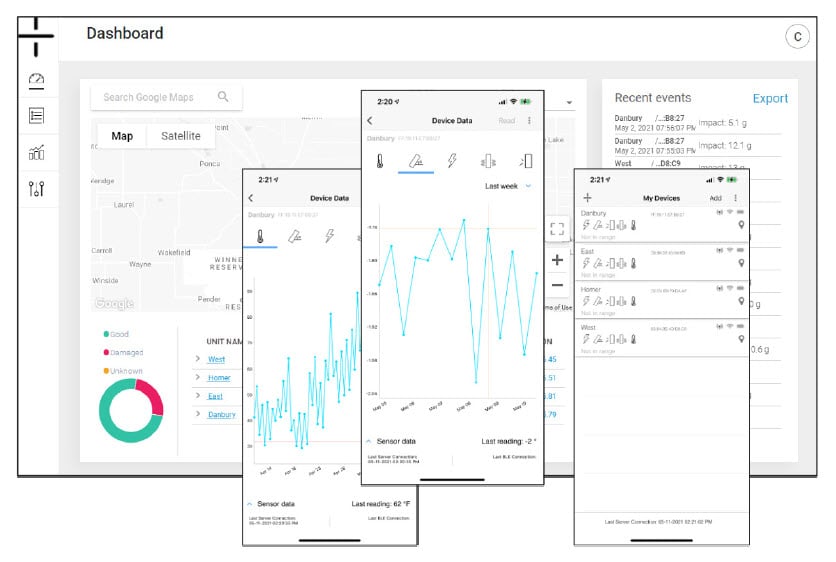
Bearing temperature monitoring serves multiple purposes for our aggregate customer in Israel. Focused on both preventive maintenance and productivity, Atoms have been installed on multiple bearings across the site.
Productivity is the key metric for this customer. Downtime, machine outages, safety concerns and labor costs all impact productivity. The Atomation Platform has had an impact on many of these supporting variables, resulting in measurable increases in productivity across their locations.
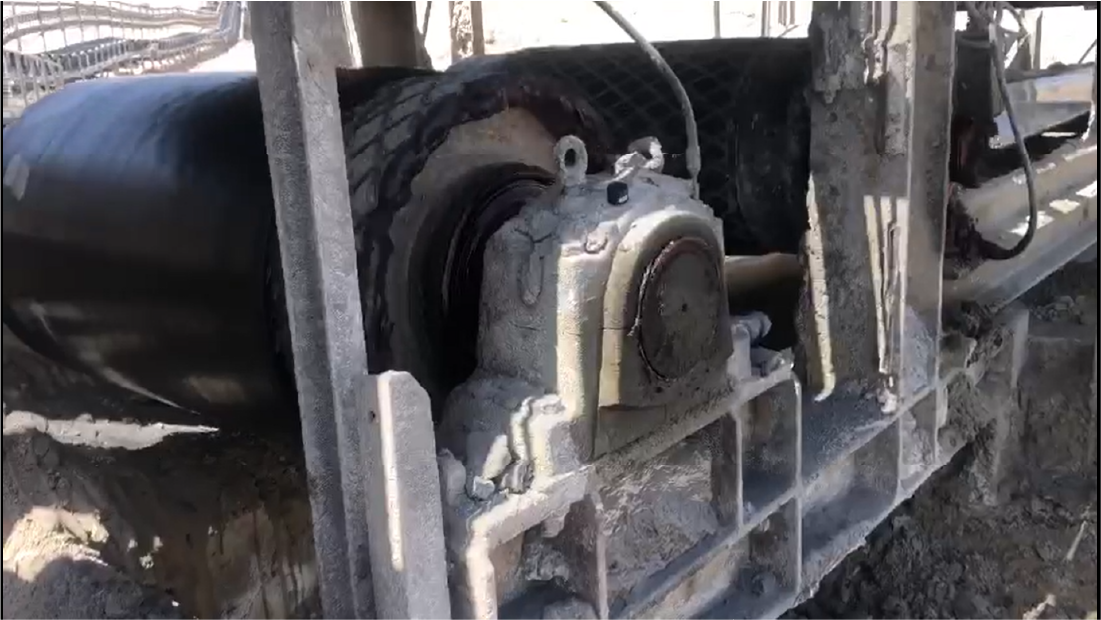
Preventive Maintenance: Bearing temperature is a critical indicator of potential machine failure. Temperature is controlled through proactive lubrication of the bearing. By reviewing machine temperatures, maintenance crews are able to identify:
- when a bearing was missed by the maintenance team in the field
- when a bearing is potentially overheating
Two recent examples highlight the Atomation solution capturing both incident types in the dashboard and via our mobile alerts.
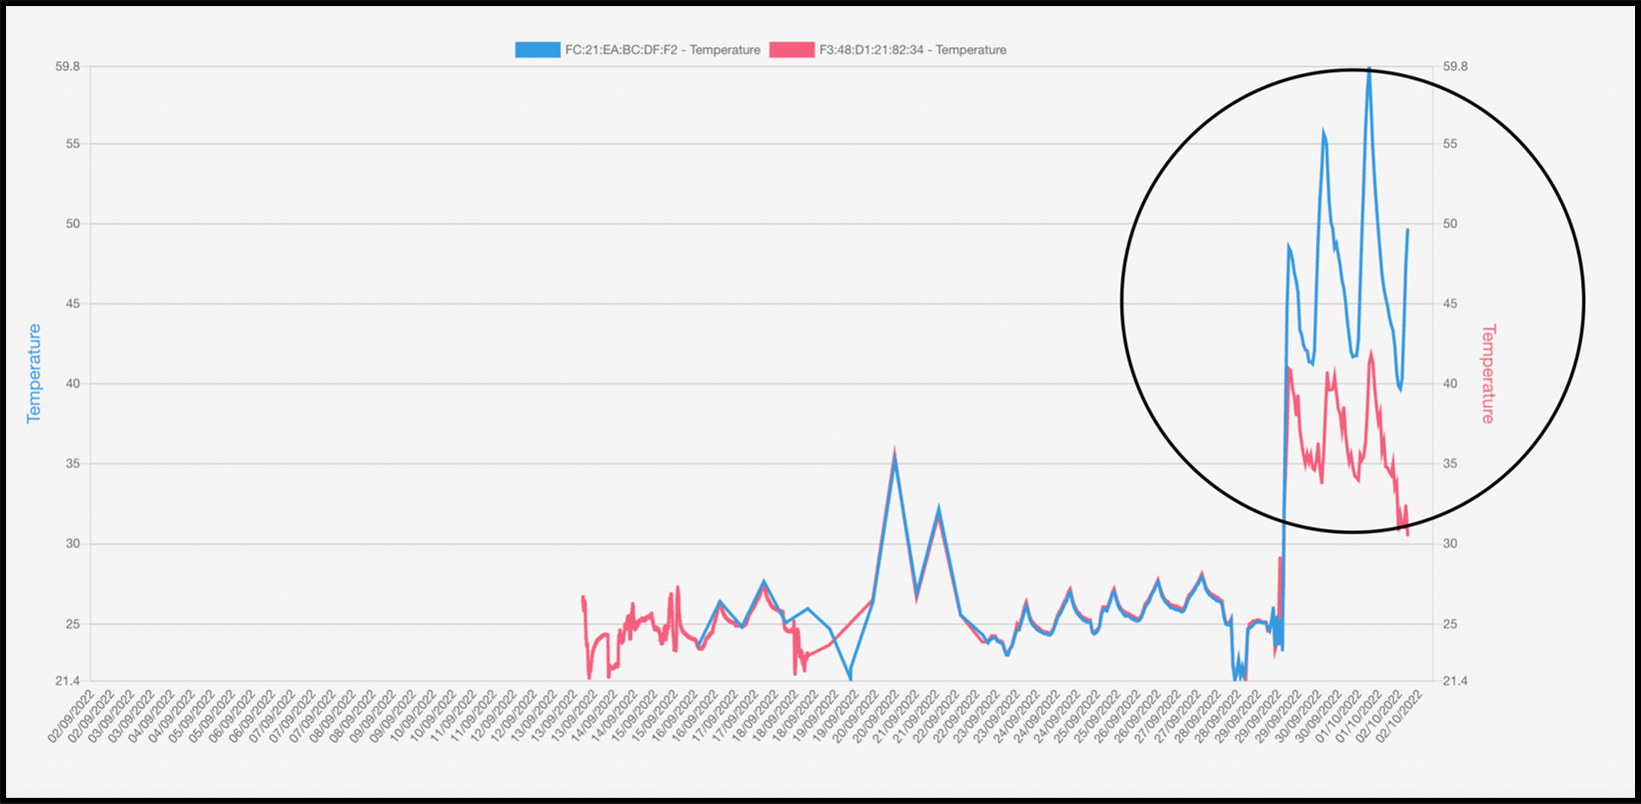
Temperature Readings for Two Bearings
Preventive Maintenance - Gaps in Service
The graph on the left tracks two bearings operating at roughly the same temperature over a period of days. A temperature increase was expected as the machines shifted from idle to active and back. The key data point in this graph is the failure of the drive bearing temperature (in blue) to drop after operation ceased. Note the drop in the red line corresponding with the operation of the bearing. After investigation, the team identified that this bearing was missed in the regular maintenance rounds.
The team was able to correct the gap in service and the bearing temperature dropped back to normal levels based on the ambient temperature post-service, preventing a potential failure.
Maintenance teams at this facility use the Atomation platform weekly to view bearing temps and performance, identify problems, and improve overall site maintenance.
Preventive Maintenance - Rapid Temperature Increase Signifying Potential Bearing Issue
In the graph on the right, a rapid temperature increase on a monitored bearing is shown. The red horizontal line indicates the threshold and the graph clearly shows when this bearing exceeds the threshold set for routine operational behavior. To prevent a potential failure:
- an alert was sent to the team lead who raised the alarm at the facility
- the team shut down the line to investigate and provide necessary maintenance
- the drive bearing was lubricated
- the bearing returned to normal operating temperature
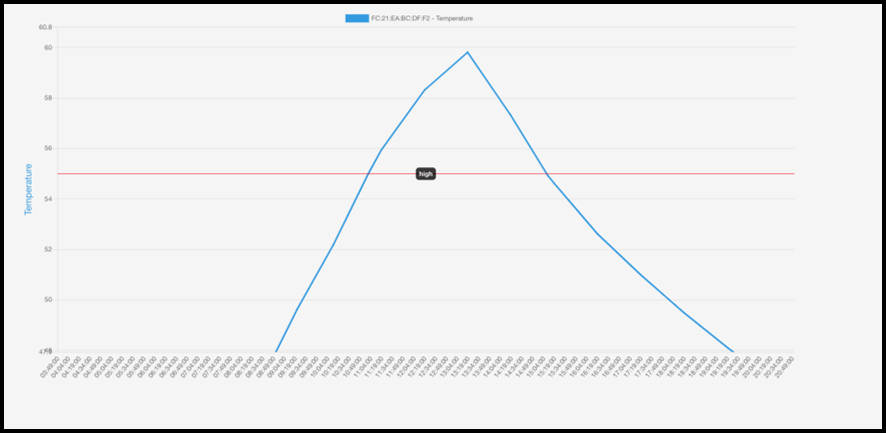
Temperature Graph Peak for a Single Bearing
Productivity Management
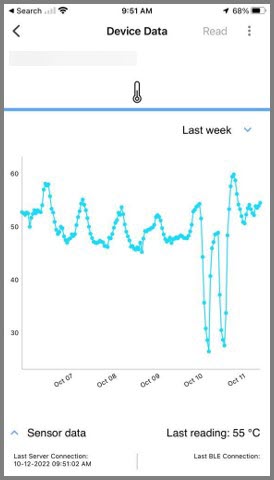
Another key use case for temperature is as a proxy to determine overall usage. Temperature graphs clearly show when equipment is operational. In the graph on the right (a screenshot of the temperature graph from the Atomation mobile app), managers can see when productivity declined for a particular line over a period of days.
By tracking this information, better decisions about staffing, maintenance needs, and overall shift productivity can be reached. In this case, these declines in temperature were due to a staffing issue, resulting in the shutdown of the line for a period of time.
Monitor Equipment in Harsh Environments
With durable and NEMA 6X rated cases, Atoms can be used in places other sensors can't. Check out these additional articles and use cases and then contact us to schedule a demo today.
